CO2MeterHacking: Difference between revisions
Use T568B pin numbering |
→Investigation & findings: add link to another pdf describing info on a serial protocol |
||
| (6 intermediate revisions by one other user not shown) | |||
| Line 2: | Line 2: | ||
|Name=CO2MeterHacking | |Name=CO2MeterHacking | ||
|Picture=Voltcraft-c100.jpg | |Picture=Voltcraft-c100.jpg | ||
|Status= | |Status=Completed | ||
|Contact= bertrik | |Contact= bertrik | ||
}} | }} | ||
| Line 32: | Line 32: | ||
The CO-100 seems to miss a bunch of components that can be mounted on the PCB, close to the RJ45 connection (most likely an RS232 chip with charge pump capacitors). | The CO-100 seems to miss a bunch of components that can be mounted on the PCB, close to the RJ45 connection (most likely an RS232 chip with charge pump capacitors). | ||
[[File:Co-100.jpg|thumb|left|components around the RJ45 connector]] | [[File:Co-100.jpg|thumb|left|components around the RJ45 connector]] | ||
http://co2meters.com/Documentation/AppNotes/AN146-RAD-0401-serial-communication.pdf has some information on what looks like a clone/similar device, describing a serial cable for the RJ45, and the protocol used, as well as some info on re-calibration. Commands/Identifiers seem to match. | |||
The CO<sub>2</sub> sensor in the CO-100 is a [http://www.zyaura.com/products/ZG_module.asp ZyAura ZG-01 module]. | The CO<sub>2</sub> sensor in the CO-100 is a [http://www.zyaura.com/products/ZG_module.asp ZyAura ZG-01 module]. | ||
| Line 132: | Line 134: | ||
! Remark | ! Remark | ||
|- | |- | ||
| D1 || ZG-C || ZG01 clock signal | | D1 || ZG-C || ZG01 clock signal, 3.3V | ||
|- | |- | ||
| D2 || ZG-D || ZG01 data signal | | D2 || ZG-D || ZG01 data signal, 3.3V | ||
|- | |- | ||
| GND || ZG-G || ZG01 ground | | GND || ZG-G || ZG01 ground | ||
|- | |- | ||
| 5V || | | 5V || ? || Supply voltage from 8P8C, about 6V! | ||
|} | |} | ||
| Line 153: | Line 155: | ||
On each falling edge of the clock line, a sample of the data line is taken until a total of 40 bits is received. | On each falling edge of the clock line, a sample of the data line is taken until a total of 40 bits is received. | ||
If the time between a bit and the previous bit is longer than 2 milliseconds, it is assumed that a new 5-byte frame has started. | If the time between a bit and the previous bit is longer than 2 milliseconds, it is assumed that a new 5-byte frame has started. | ||
The technical description for a very similar CO2 module: [http://www.zyaura.com/support/demo/ZG106_FW_001.ExtSpec.pdf ZG106 protocol]. | |||
=== Wireless protocol === | === Wireless protocol === | ||
| Line 168: | Line 172: | ||
The ESP version of the software uses MQTT to publish the measurement values, on the following topics (retained): | The ESP version of the software uses MQTT to publish the measurement values, on the following topics (retained): | ||
* revspace/sensors/co2 with the CO2 concentration in ppm, e.g. "400 PPM" | * revspace/sensors/co2 with the CO2 concentration in ppm, e.g. "400 PPM" | ||
* revspace/sensors/humidity with the relative humidity in percent, e.g. "43 %" | * revspace/sensors/humidity with the relative humidity in percent, e.g. "43.56 %" | ||
* revspace/sensors/temperature with the temperature in degrees Celcius, e.g. "23.9 °C" | |||
For example, running | |||
mosquitto_sub -h revspace.nl -t revspace/sensors/co2 -v | |||
produces output like | |||
revspace/sensors/co2 530 PPM | |||
revspace/sensors/co2 530 PPM | |||
revspace/sensors/co2 532 PPM | |||
revspace/sensors/co2 533 PPM | |||
=== Graphs and heat maps === | === Graphs and heat maps === | ||
Latest revision as of 12:33, 19 February 2018
| Project CO2MeterHacking | |
|---|---|

| |
| Status | Completed |
| Contact | bertrik |
| Last Update | 2018-02-19 |
status: it works. We've modified the code to work using an ESP8266 which publishes the measurement data directly on an MQTT stream.
The G, C, D, V signals from the CO2-sensor inside the CO-100 are routed internally to the RJ45-plug, so there's actually no need to open it and solder a connector on the G, C, D, V lines.
Introduction
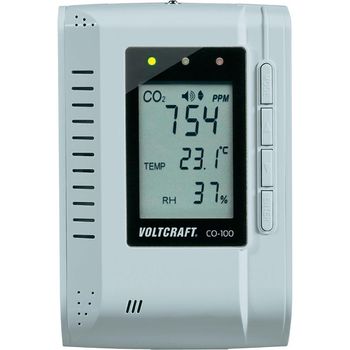
This project is about hacking the Voltcraft CO-100 CO2-meter, such that we can read the exact ppm value as displayed on the LCD.
This particular CO2-meter is present in the main space of RevSpace. Having the CO2 ppm value available as a number allows for nice things such as logging the levels over time, announce them on IRC, show them on the LedBanner, fine-grained control of the ventilation system, etc.
The user manual of the Voltcraft CO-100 says "Achtung! Der RJ45-Anschluss (siehe Kapitel 7, Position „K“) darf nicht verwendet werden. Der Anschluss ist nur für den Hersteller vorgesehen." Of course, a claim like that can only be interpreted as a challenge! :)
See also:
- http://www2.zyaura.com/support/manual/pdf/ZyAura_CO2_Monitor_Carbon_Dioxide_ZG01C%20Module%20English%20user%20manual_1404.pdf
- http://www.palebluedot.nl/jml/projects/arduino/52-reading-data-from-the-voltcraft-co-100
Investigation & findings

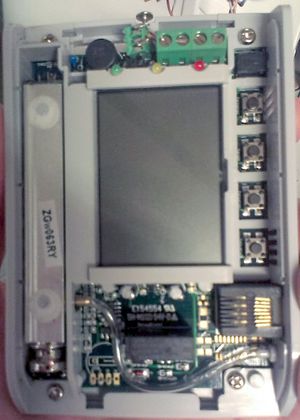
The CO2 sensor inside the CO-100 (in the left of the picture) has a sticker saying ZGw063RY. Googling for this number reveals a CO2 module that looks just like the Voltcraft CO-100, so it appears that the CO-100 is basically a rebranded ZyAura ZGw063RY module.
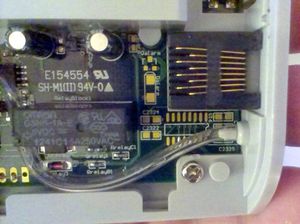
The CO-100 seems to miss a bunch of components that can be mounted on the PCB, close to the RJ45 connection (most likely an RS232 chip with charge pump capacitors).

http://co2meters.com/Documentation/AppNotes/AN146-RAD-0401-serial-communication.pdf has some information on what looks like a clone/similar device, describing a serial cable for the RJ45, and the protocol used, as well as some info on re-calibration. Commands/Identifiers seem to match.
The CO2 sensor in the CO-100 is a ZyAura ZG-01 module. This sensor uses the ZyAura protocol, which vaguely resembles SPI, see File:ZyAura CO2 Monitor Carbon Dioxide ZG01 Module english manual-1.pdf.
On the bottom left of the PCB is a set of pads that are marked with G, C, D, V, meaning Ground, Clock, Data, Voltage of the ZG01 sensor. The voltage level on the clock and data pins is 3.3V (the voltage on V pin is 3.3V too).
The ZG-01 sends 5-byte frames containing measurement values:
- byte 0 is an identifier for the measurement item, e.g. whether it is a CO2 ppm value or a temperature.
- byte 1 and 2 contain the value of the item (byte 1 is the MSB, byte 2 is the LSB)
- byte 3 is a checksum over bytes 0-2, just the sum modulo 256.
- byte 4 is always 0x0D
Besides the CO2 ppm value and temperature, it also sends various other (so far unknown) measurement items.
Measurement items encountered so far:
| Item | Value | Remark |
|---|---|---|
| 0x41 'A' | 3290 | Relative humidity in units of 0.01% |
| 0x42 'B' | 4708 | Temperature in Kelvin (unit of 1/16th K) |
| 0x43 'C' | 2964 | ? |
| 0x46 'F' | 6882 | Temperature in degrees Fahrenheit (unit of 0.01)? |
| 0x4F 'O' | 7754 | ? |
| 0x50 'P' | 857 | CO2 concentration in ppm |
| 0x52 'R' | 10438 | Barometric pressure? |
| 0x56 'V' | 10443 | Barometric pressure? |
| 0x57 'W' | 7880 | ? |
| 0x6D 'm' | 2559 | Seems to always have same value |
| 0x6E 'n' | 17146 | ? |
| 0x71 'q' | 855 | Always close to value of item 0x50 |
Pin-out of the 8P8C ("RJ45") connector on the side of the CO-100:
| T568B | Colour | Signal |
|---|---|---|
| 1 | orange-white | Supply voltage out, measured about 5.7V |
| 2 | orange | DATA, 3.3V level |
| 3 | green-white | CLOCK, 3.3V level |
| 4 | blue | GND |
Hardware
NRF version
The ZG-01 module and NRF24L01+ transceiver are connected to the Arduino as follows:
| Arduino | Module | Remark |
|---|---|---|
| D2 | ZG-C | ZG01 clock signal |
| D3 | ZG-D | ZG01 data signal |
| GND | NRF-1, ZG-G | NRF ground, ZG01 ground |
| 3V3 | NRF-2 | NRF power |
| D8 | NRF-3 | NRF CE |
| D9 | NRF-4 | NRF CSN |
| D13 | NRF-5 | NRF SCK |
| D11 | NRF-6 | NRF MOSI |
| D12 | NRF-7 | NRF MISO |
| - | 8 | NRF IRQ - not connected |
ESP version
In the ESP version of the CO2 meter, signals from the ZG-01 module are connected as follows:
| Wemos D1-mini | ZG01 | Remark |
|---|---|---|
| D1 | ZG-C | ZG01 clock signal, 3.3V |
| D2 | ZG-D | ZG01 data signal, 3.3V |
| GND | ZG-G | ZG01 ground |
| 5V | ? | Supply voltage from 8P8C, about 6V! |
Software
The basic function of the software on the arduino is to monitor the C and D signals, until a CO2 measurement is received from the ZG-01, then send it using the wireless transceiver.
The source code can be found on github. This archive contains two arduino projects:
- one for an Arduino Pro Mini, using an NRF24L01+ for the wireless connection
- one for an ESP8266, sending measurement values directly to MQTT over the WiFi.
ZG-01 decoding
The ZG-01 protocol is decoded using a simple state machine. On each falling edge of the clock line, a sample of the data line is taken until a total of 40 bits is received. If the time between a bit and the previous bit is longer than 2 milliseconds, it is assumed that a new 5-byte frame has started.
The technical description for a very similar CO2 module: ZG106 protocol.
Wireless protocol
NRF
To control the NRF24L01+ wireless transceiver, we use the gcopeland fork of the RF24 library. This library has several important fixes over the original RF24 library (and is used in the receiver as well).
The wireless message consist of 7 bytes:
- 0x06 "CO_2" <MSB> <LSB> for the CO2 concentration message (in ppm)
- 0x06 "HUMI" <MSB> <LSB> for the relative humidity message (in units of 0.01%)
ESP
The ESP version of the software uses MQTT to publish the measurement values, on the following topics (retained):
- revspace/sensors/co2 with the CO2 concentration in ppm, e.g. "400 PPM"
- revspace/sensors/humidity with the relative humidity in percent, e.g. "43.56 %"
- revspace/sensors/temperature with the temperature in degrees Celcius, e.g. "23.9 °C"
For example, running
mosquitto_sub -h revspace.nl -t revspace/sensors/co2 -v
produces output like
 revspace/sensors/co2 530 PPM
 revspace/sensors/co2 530 PPM
 revspace/sensors/co2 532 PPM
 revspace/sensors/co2 533 PPM
Graphs and heat maps
Interesting visualizations: