StofAnanas
| Project StofAnanas | |
|---|---|

| |
| Showing particulate matter concentration as a coloured light | |
| Status | In progress |
| Contact | bertrik |
| Last Update | 2019-12-09 |
The concept
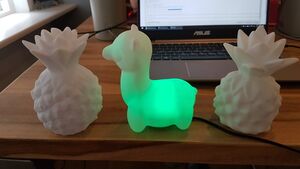
The stofananas/stoflama/pmlamp shows airborne particulate matter concentration from the nearest luftdaten citizen science measurement station as a colour on a LED lamp, inspired by http://stoflamp.nl The data that the LED colour is based on is retrieved over WiFi from the luftdaten website every 5 minutes.
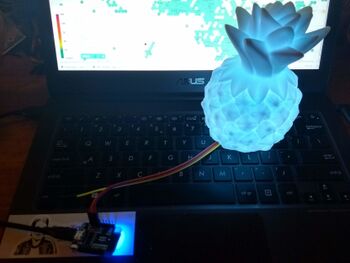
This lamp is a soft plastic translucent pine apple ("ananas"), bought at the "Action" store.
Features:
- The lamp shows PM10 particulate matter concentration as a colour, from dark blue for low concentration to bright pink for high concentration
- The lamp retrieves the PM value over wifi from the the luftdaten website, there is a one-time setup to configure your WiFi network so the device can access the internet
- The lamp automatically determines the nearest luftdaten particulate measurement station, by doing WiFi based geolocation.
- The number/id of the luftdaten station can also be entered manually during the one-time setup.
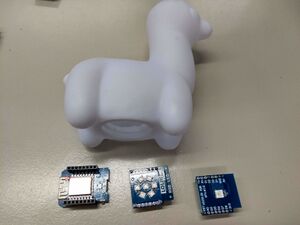
- The hardware consists of a Wemos D1 mini board (about E3,-), a LED shield and a USB power supply + cable.
- The software supports two different kinds of Wemos D1 mini LED "shield", both the shield with a single LED and the shield with 7 LEDs arranged in a star.
Ideas/nice to have:
- Use streaming mode of ESP8266HttpClient to parse JSON directly from a stream, avoiding memory problems / stack overflows
- Built-in web server, with links to historic measurement data of the sensor it's monitoring, link to google maps, etc.
- complication: the nice graphs on madavi.de are based on the *hardware id* (not database id), we can't get that automatically
- just show a table with all properties in the left column (PM values, WGS84 location) and their values in the right column?
- The lamp "breathes" by varying the intensity over time, e.g. a cycle of 10 seconds where the light dims a bit and brightens a bit
- perhaps increase the breathing rate for higher PM?
- perhaps modulate the colour saturation instead of intensity?
- flash to indicate problems with the particulate matter module, so you can know something is wrong with your Luftdaten sensor and when to power-down/up to reset it again
- some kind of compatibility mode with the stoflamp from stoflamp.nl
Next steps:
- Run the software directly on a WiFi-enabled E14 RGB lamp from the Action store. This lamp has the microcontroller already built in. No separate USB power adapter is needed, it runs directly off 230V. See the WifiLamp project.
Building it

It consists of a few parts:
- a Wemos D1 mini board
- a LED shield, either the one with 1 LED, or the one with 7 LEDs
- a 5V USB charger with stable voltage output + USB cable
- a plastic lamp enclosure
Steps:
- solder the female headers onto the Wemos D1 mini, start with soldering just one pin so you can re-heat it and adjust it later if needed.
- push the male headers into the female headers and solder the male headers onto the LED shield
- flash the firmware into the Wemos d1 mini board (if not done already)
- connect the USB micro cable to the Wemos d1 mini board and verify that it works as expected
- remove the USB micro cable and push the Wemos d1 mini board + LED shield into the plastic enclosure
- reattach the USB micro cable and verify it still works
It helps to make a few little knife cuts in the plastic of the enclosure to make the wemos d1 mini board fit more easily.
Operation Manual

Programming
- connect everything up as indicated under 'hardware' and connect the Wemos D1 board to the USB port of your development PC / laptop
- flash the software into the Wemos D1 mini, typically from the command line using platformio:
pio run -t upload
This assumes you have platformio installed, this is done on Debian Linux for example, as follows:
 sudo apt-get install python-pip
 sudo pip install platformio
Configuration

Automatic configuration:
- power up the lamp
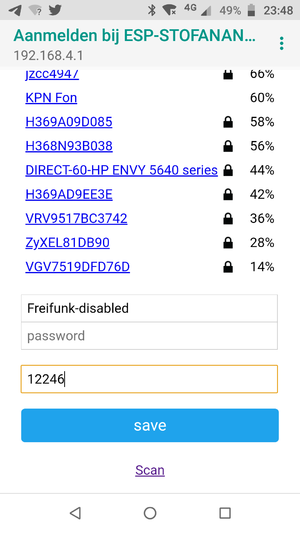
- on a mobile phone, connect to the "ESP-PMLAMP" network, and select login
- when presented with the captive portal, select a WiFi network, fill in the WiFi password, leave the luftdaten id field empty, press SAVE
- the closest luftdaten particulate matter sensor will automatically be determined
Manual configuration:
- on https://netherlands.maps.luftdaten.info find the particulate matter station you want to follow and note the number of the station, for example "12246"
- on a mobile phone, connect to the "ESP-PMLAMP" network, and select login
- when presented with the captive portal, select a WiFi network, fill in the WiFi password, AND ALSO fill in the number you looked up earlier, press SAVE
Alternatively:
- make sure at least the WiFi credentials have been entered and saved
- open a console to the serial port of the wemos D1 mini (115200 bps) and enter the following command:
config auto
- within a few seconds, you should see it prints the current approximate geographic location and the id of the luftdaten station, the id should be non-zero. It is saved in internal memory.
Usage
- Power up the lamp while in range of the WiFi network you configured. The LED shows a colour animation when starting up (starting with red and ending with red)
- The LED turns white for a short time, then changes to a colour representing a PM concentration
- A new PM measurement is retrieved automatically every 5 minutes.
- A flashing colour (1x per second) means that something went wrong, either communication with the luftdaten server or decoding the luftdaten server response
Hardware
The electronic part consists of a Wemos D1 mini board and a LED shield.
The LED can be one of these LED shields:
- 1-LED shield: https://wiki.wemos.cc/products:d1_mini_shields:ws2812b_rgb_shield
- 7-LED shield: https://wiki.wemos.cc/products:d1_mini_shields:rgb_led_shield
The 7-LED shield is a lot brighter than the 1-LED shield.
Software
Getting and building the source code
Source code is available on github.
To compile and upload it, I use platform io:
pio run -t upload
You can also compile it with the Arduino IDE, libraries used:
- WiFiManager (v 0.14) is used to manage WiFi connection to the local AP
- ArduinoJSON (v 6.11) for the parsing the luftdaten response
- FastLED (v 3.2.9) is used to control the RGB LED
Luftdaten interface
The current measurement value of a particular sensor can be determined by parsing the JSON messages retrieved over a REST interface, by performing an HTTP GET on URL
http://api.luftdaten.info/v1/sensor/<sensor-id>/
where <sensor-id> is the database id used by luftdaten (and visible on their map). The trailing slash in the URL is significant.
For example:
http://api.luftdaten.info/v1/sensor/12246/
The software looks for the "P1" (PM10) sensor value in the JSON message and averages all measurements it finds (usually the current one and a previous one).
Colour mapping
Mapping is as follows, with piecewise linear interpolation:
- 0 ug/m3: deep blue
- 15 ug/m3: green
- 30 ug/m3: yellow
- 60 ug/m3: red
- 120+ ug/m3: pink