StofAnanas
| Project StofAnanas | |
|---|---|

| |
| Showing particulate matter concentration as a coloured light | |
| Status | In progress |
| Contact | bertrik |
| Last Update | 2019-06-25 |
The idea
Show current airborne particulate matter concentration using a LED light in a lamp, inspired by http://stoflamp.nl The data that the LED colour is based on is simply retrieved over WiFi from the luftdaten website.
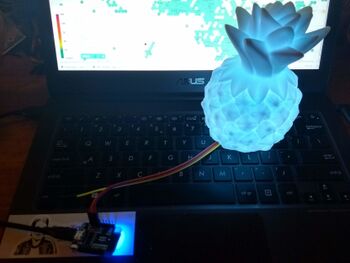
This lamp is a soft plastic translucent pine apple ("ananas"), bought at the "Action" store.
Features:
- The lamp shows particulate matter concentration as a colour, from dark blue for low concentration to bright pink for high concentration
- The lamp retrieves the PM value over wifi from the the luftdaten website
- The luftdaten measurement station can be entered at the same time as when wifi credentials are entered.
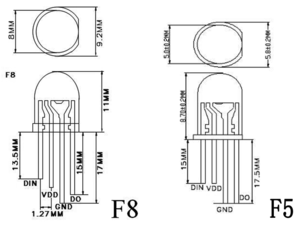
- should be compatible with Wemos D1 RGB LED shields. My PL9823 LED appears to be compatible with WS2812B LEDs.
Ideas/nice to have:
- The lamp "breathes" by varying the intensity over time, e.g. a cycle of 10 seconds where the light dims a bit and brightens a bit
- perhaps increase the breathing rate for higher PM
- perhaps modulate the colour saturation instead of intensity
- Automatic determination of location by means of wifi location, so you don't even need to input a luftdaten monitoring station id (do this on every startup for example)
- example query to get (very coarse) position data from Mozilla:
https://location.services.mozilla.com/v1/geolocate?key=test
- example query to list of sensors centered around a location from Luftdaten:
http://api.luftdaten.info/v1/filter/area=52.022,4.692,1.0
- Remote control over IR
Operation Manual

Programming
- connect everything up as indicated under 'hardware' and connect the Wemos D1 board to the USB port of your development PC / laptop
- flash the software into the Wemos D1 mini, typically from the command line using platformio:
pio run -t upload
Configuration
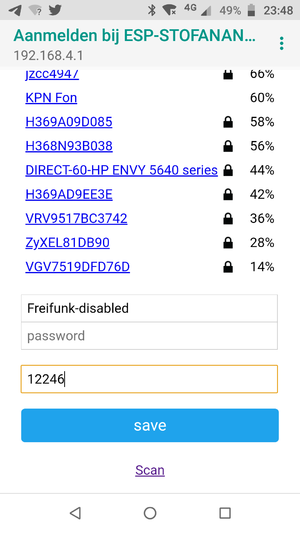
- on https://netherlands.maps.luftdaten.info find the particulate matter station you want to follow and note the number of the station, for example "12246"
- on a mobile phone, connect to the "ESP-STOFANANAS" network, and select login
- when presented with the captive portal, select a WiFi network, fill in the WiFi password, AND ALSO fill in the number you looked up earlier, press SAVE
- NOTE: when the configuration is ongoing, the LED will be YELLOW, it turns OFF when configuration is done.
Alternatively:
- open a console to the serial port (115200 bps) and run the following commands:
- to get a list of available commands:
help
- to auto-configure the luftdaten id (does a WiFi scan to geolocate and tries to find a particulate matter sensor close by):
config auto
- it should print the id of the luftdaten station, should be non-zero
Usage
- Power up the lamp while in range of the WiFi network you configured
- The LED should start yellow (connecting to the WiFi), then briefly change to OFF (retrieving PM value from Luftdaten), then change to a colour representing a PM concentration
- A new PM measurement is retrieved every 5 minutes.
Hardware

The lamp is controlled by an ESP8266, a Wemos D1 mini board. The LED is an RGB LED with built-in PL9823 controller. The PL9823 is compatible with the WS2812B as far as I can tell (the WS2812B driver in the FastLED library works with the PL9823).
Connections (using dupont female-female):
- LED Din to Wemos D1 mini pin D3
- LED Gnd to Wemos D1 mini pin GND
- LED Vdd to Wemos D1 mini pin 5V
This is the same pinout as used by the Wemos WS2812B RGB shield
Software
Getting and building the source code
Source code is available on github.
To compile and upload it, I use platform io:
pio run -t upload
You can also compile it with the Arduino IDE, libraries used:
- WiFiManager (v 0.14) is used to manage WiFi connection to the local AP
- ArduinoJSON (v 6.11) for the parsing the luftdaten response
- FastLED (v 3.2.9) is used to control the RGB LED
Luftdaten interface
The current measurement value of a particular sensor can be determined by parsing the JSON messages retrieved over a REST interface, by performing an HTTP GET on URL
http://api.luftdaten.info/v1/sensor/<sensor-id>/
where <sensor-id> is the database id used by luftdaten (and visible on their map). The trailing slash in the URL is significant.
For example:
http://api.luftdaten.info/v1/sensor/12246/
The software looks for the "P1" (PM10) sensor value in the JSON message and averages all measurements it finds (usually the current one and a previous one).
Colour mapping
Mapping is as follows, with piecewise linear interpolation:
- 0 ug/m3: deep blue
- 25 ug/m3: green
- 50 ug/m3: yellow
- 100 ug/m3: red
- 200 ug/m3 (and higher): pink