DustSensor: Difference between revisions
| (76 intermediate revisions by the same user not shown) | |||
| Line 8: | Line 8: | ||
== Introduction == | == Introduction == | ||
<strong> | |||
The info on this page is obsolete: | |||
* The luftdaten.info platform is now called sensor.community | |||
* I modfied my sensor into a sensor.community node, so there is no longer an intermediate MQTT step | |||
</strong> | |||
[[File:stofradar.png|thumb|right|PM10 in the morning of 2018-06-03]] | |||
[[File:stofradar2.png|thumb|right|PM10 at around 2018-06-03 20:50 UTC]] | |||
To get an idea of the levels of atmospheric particulate matter around my house, I ordered some dust sensor modules to play around with. | |||
In particular, I ordered these ones: | |||
* The [http://www.plantower.com/en/content/?110.html Plantower PMS 7003] ([https://nl.aliexpress.com/item/dit_is_m/32639894148.html AliExpress link]); | |||
* The SDS011 ([https://nl.aliexpress.com/item/aliexpress/32617788139.html AliExpress link]). | |||
The PMS7003 is being advertised as an advanced generation of dust sensor (7th generation), while still reasonably priced (E15,-). | |||
It uses a laser to perform the measurement and contains a small fan to move the air around. | |||
In parallel with the atmospheric particulate matter level measurement, my device also measures basic meteo data using a BME280 module: temperature, relative humidity and air pressure. | |||
I recommend to also get the PMS7003 cable converter board. The pitch of the connector on the sensor module is slightly non-standard: 2 x 5 pins with a spacing of 0.05 inch (instead of the common 0.1 inch spacing). | |||
The data produced by this sensor is sent as JSON to a MQTT server. | The data produced by this sensor is sent as JSON to a MQTT server. | ||
From there it is picked up by | From there it is picked up by a protocol converter: | ||
a [https://github.com/bertrik/dustsensorbridge custom written Java application] to forward it to the RIVM samenmeten website | |||
and forward it to luftdaten.info | |||
=== Future work === | === Future work === | ||
Next steps: | Next steps: | ||
* | * build more luftdaten.info sensors and put them up in Gouda | ||
* | * build a luftdaten.info sensor and put it up at RevSpace | ||
* | * investigate a LoRa version of the software + TTN forwarder so we can put up a sensor at Meteo Gouda (kinderboerderij). | ||
* can we use Cayenne as a container to carry the dust sensor data over LoRa? | |||
== Results == | == Results == | ||
| Line 44: | Line 52: | ||
== Hardware == | == Hardware == | ||
=== PMS7003 === | |||
[[File:dustsensor_window.jpg|thumb|right]] | [[File:dustsensor_window.jpg|thumb|right]] | ||
PMS7003 data sheets can be found: | |||
* [https://www.pdf-archive.com/2017/04/12/plantower-pms-7003-sensor-data-sheet/plantower-pms-7003-sensor-data-sheet.pdf here (english)] and | * [https://www.pdf-archive.com/2017/04/12/plantower-pms-7003-sensor-data-sheet/plantower-pms-7003-sensor-data-sheet.pdf here (english)] and | ||
* [http://aqicn.org/air/view/sensor/spec/pms7003.pdf here (chinese)] | * [http://aqicn.org/air/view/sensor/spec/pms7003.pdf here (chinese)] | ||
The | The PMS7003 takes 5V to run and communicates using 3.3V levels. | ||
I connect it using a NodeMCU. | I connect it using a NodeMCU. | ||
The module gives an estimate of the total mass of the particles (microgram/m3) in 3 categories: | The module gives an estimate of the total mass of the particles (microgram/m3) in 3 categories: PM10, PM2.5 and PM1.0, both for "standard particle" (CF-1) and "standard atmosphere". | ||
It also makes an estimate of the raw number of particles per size category, total 6 categories: 0.3-0.5-1.0-2.5-5.0-10 micrometer. | It also makes an estimate of the raw number of particles per size category, total 6 categories: 0.3-0.5-1.0-2.5-5.0-10 micrometer. | ||
I don't know how it actually works on the inside and is able to make a distinction between particles of different size. | I don't know how it actually works on the inside and is able to make a distinction between particles of different size. | ||
| Line 64: | Line 74: | ||
!Remark | !Remark | ||
|- | |- | ||
| | |- | ||
|PMS7003-RST | |PMS7003-RST | ||
|Pulled-up to 3.3V on NodeMCU side, may not be actually needed | |Pulled-up to 3.3V on NodeMCU side, may not be actually needed | ||
|- | |- | ||
| | |- | ||
|PMS7003-SET | |PMS7003-SET | ||
|Pulled-up to 3.3V on NodeMCU side, may not be actually needed | |Pulled-up to 3.3V on NodeMCU side, may not be actually needed | ||
|- | |- | ||
| | |D1 | ||
|PMS7003-TX | |PMS7003-TX | ||
|NodeMCU receive, PMS7003 transmit | |NodeMCU receive, PMS7003 transmit | ||
|- | |- | ||
| | |D2 | ||
|PMS7003-RX | |PMS7003-RX | ||
|NodeMCU transmit, PMS7003 receive | |NodeMCU transmit, PMS7003 receive | ||
|- | |||
|D3 | |||
|BME280-SDA | |||
|I2C-SDA | |||
|- | |||
|D4 | |||
|BME280-SCL | |||
|I2C-SCL | |||
|- | |- | ||
|GND | |GND | ||
| Line 102: | Line 112: | ||
Special thanks to [[User:Crashjuh|Crashjuh]] for helping with the cable, putting dupont connectors on them, making it a lot easier to connect the module to an ESP8266. | Special thanks to [[User:Crashjuh|Crashjuh]] for helping with the cable, putting dupont connectors on them, making it a lot easier to connect the module to an ESP8266. | ||
=== SDS011 === | |||
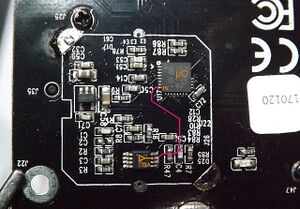
[[File:Assembly-side-of-the-SDS011-PCB-after-removing-the-shielding-cover-The-graphic-overlay.jpg|thumb|image from SDS research paper showing the STM32F038K6 processor]] | |||
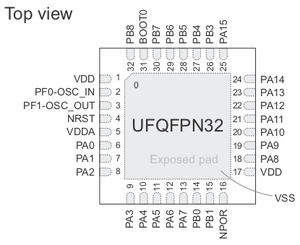
[[File:STM32F038K6_pinout.png|thumb|STM32F038K6_pinout]] | |||
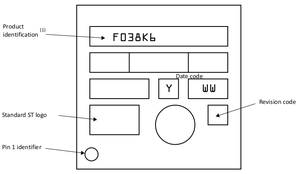
[[File:STM32F038K6_package.png|thumb|STM32F038K6_package marking]] | |||
Datasheets: | |||
* [https://nettigo.pl/attachments/415 command protocol] | |||
The SDS011 has a connector that fits a cable of type | |||
JST XH 2.54 mm 7-pin | |||
Reverse engineering: | |||
* it contains a [https://www.st.com/content/st_com/en/products/microcontrollers-microprocessors/stm32-32-bit-arm-cortex-mcus/stm32-mainstream-mcus/stm32f0-series/stm32f0x8/stm32f038k6.html STM32F038K6 processor] in a UFQFPN32 package. | |||
* interesting research paper that shows some of the internals of the SDS011: https://www.researchgate.net/publication/320290219_Assessment_of_Measurement_Uncertainties_for_a_SDS011_low-cost_PM_sensor_from_the_Electronic_Signal_Processing_Perspective | |||
* another research paper (DE version?): https://www.researchgate.net/publication/332211397_Potenzial_und_Grenzen_des_kostengunstigen_SDS011_Partikelsensors_bei_der_Uberwachung_urbaner_Luftqualitat | |||
* The optical sensor input pin (marked magenta in the research paper above) is PA2 (pin 8) | |||
* SWD is on pins PA13/PA14 (pin 23/34), not easily accessible from the outside | |||
=== Honeywell HPMA115S === | |||
Info: | |||
* [https://sensing.honeywell.com/honeywell-sensing-particulate-hpm-series-datasheet-32322550 datasheet] | |||
* data/power-plug is Molex 51021-0800 | |||
Reverse engineering: | |||
== Software == | == Software == | ||
The software archive can be found at github, it consists of the following parts: | The software archive can be found at github, it consists of the following parts: | ||
* | * [https://github.com/bertrik/sds011 esp arduino software for reading the SDS011] and sending it as an MQTT stream; | ||
* | * [https://github.com/bertrik/pms7003_esp arduino software for reading the PMS7003] and sending it as an MQTT stream; | ||
* a Java based [https://github.com/bertrik/ | * a Java based [https://github.com/bertrik/dustsensorbridge bridge application] that takes the MQTT data produced by the arduino and forwards it to other backends, like the RIVM influx database, luftdaten.info API. | ||
=== Particulate matter sensor === | |||
The dust sensor software is written for the Arduino environment. | |||
Typing 'make' builds and runs unit tests that verify parsing of measurement data and construction of command data. | Typing 'make' builds and runs unit tests that verify parsing of measurement data and construction of command data. | ||
| Line 115: | Line 151: | ||
Libraries used: | Libraries used: | ||
* SoftwareSerial for serial communication with the sensor | * SoftwareSerial (built-in) for serial communication with the sensor | ||
* WiFiClient for WiFi connectivity | * WiFiClient (built-in) for WiFi connectivity | ||
* WiFiManager to present a captive portal and allow selection of an AP to connect to the internet | * WiFiManager (tzapu) to present a captive portal and allow selection of an AP to connect to the internet | ||
* PubSubClient to handle publishing of data over MQTT | * PubSubClient (Nick O'Leary) to handle publishing of data over MQTT | ||
* BME280I2C and wire for interacting with a BME280 for basic meteo data (temperature, humidity, pressure) | * BME280I2C (Tyler Glenn) and wire for interacting with a BME280 for basic meteo data (temperature, humidity, pressure) | ||
The Arduino software has platformio.org configuration files, so if you're using that, you can just build it with | |||
The | pio run | ||
==== PMS7003 ==== | |||
Reading measurements from the pms7003 works, sending commands to the module does not. I don't know yet whether this is a hardware or software problem. | |||
Typing 'make' builds and runs unit tests that verify parsing of measurement data and construction of command data. | |||
The sub-directory 'pms7003_esp' contains the .ino file to be opened in the Arduino IDE. | |||
=== | ==== SDS011 ==== | ||
Typing 'make' builds and runs unit tests that verify parsing of measurement data and construction of command data. | |||
The sub-directory 'sds011_esp' contains the .ino file to be opened in the Arduino IDE. | |||
== References == | == References == | ||
[ | Measurement data of this particular sensor: | ||
* [https://keetweej.vanheusden.com/grafana/d/JUIM-ikmz/rivm-data?orgId=2 Grafana page of my sensor data]. | |||
* [https://www.madavi.de/sensor/graph.php?sensor=esp8266-9137604-pms particulate matter graphs] at madavi | |||
* [https://www.madavi.de/sensor/graph.php?sensor=esp8266-9137604-bme280 humidity and pressure graphs] at madavi | |||
Overview of dust sensor types and comparisons between them: | |||
* [http://aqicn.org/sensor/pms5003-7003/ Page on aqicn about the PMS5003/7003] | |||
* list of sensors [https://www.samenmetenaanluchtkwaliteit.nl/sensoren-voor-fijn-stof-pm25pm10 from "samen meten aan luchtkwaliteit"]. | * list of sensors [https://www.samenmetenaanluchtkwaliteit.nl/sensoren-voor-fijn-stof-pm25pm10 from "samen meten aan luchtkwaliteit"]. | ||
* another [http://aqicn.org/sensor/ overview of dust sensors]. | * another [http://aqicn.org/sensor/ overview of dust sensors]. | ||
| Line 252: | Line 191: | ||
* [https://scapeler.wordpress.com/ scapeler] | * [https://scapeler.wordpress.com/ scapeler] | ||
== | == Visualizing dust data == | ||
To create nice graphs, I used the following stack of tools/applications: | See also my [[Stofradar]] page. | ||
=== Grafana === | |||
To create nice graphs in Grafana, I used the following stack of tools/applications: | |||
* a dust sensor, as described here, that publishes measurement data towards an MQTT server | * a dust sensor, as described here, that publishes measurement data towards an MQTT server | ||
* an MQTT server to accept the data and forward it to subscribers | * an MQTT server to accept the data and forward it to subscribers | ||
| Line 260: | Line 202: | ||
* grafana, to grab the data from the database and display it | * grafana, to grab the data from the database and display it | ||
=== Sensor === | ==== Sensor ==== | ||
The sensor produces JSON, grouping the information from one message from the module together. Example | The sensor produces JSON, grouping the information from one message from the module together. Example | ||
bertrik/pms7003/json {"pms7003":{"pm1_0":2,"pm2_5":3,"pm10":4},"bme280":{"t":21.1,"rh":50,"p":1012.4}} | bertrik/pms7003/json {"alive":1138,"pms7003":{"pm1_0":2,"pm2_5":3,"pm10":4},"bme280":{"t":21.1,"rh":50,"p":1012.4}} | ||
=== Telegraf === | ==== Telegraf ==== | ||
Things I did: | Things I did: | ||
* downloaded and installed the Telegraf .deb from [https://github.com/influxdata/telegraf here]. | * downloaded and installed the Telegraf .deb from [https://github.com/influxdata/telegraf here]. | ||
| Line 280: | Line 222: | ||
systemctl restart telegraf | systemctl restart telegraf | ||
=== Grafana === | ==== Grafana ==== | ||
Add a data source, pointing to the influx DB. Provide credentials and verify by pressing the 'test connection' button. | Add a data source, pointing to the influx DB. Provide credentials and verify by pressing the 'test connection' button. | ||
| Line 306: | Line 248: | ||
kortetermijneffecten van fijn stof. | kortetermijneffecten van fijn stof. | ||
== | == Sensor.community interface == | ||
Most of the [https://github.com/opendata-stuttgart/meta/wiki/APIs sensor.community upload protocols] are described on the sensor.community wiki. | |||
[https://github.com/opendata-stuttgart/meta/wiki/APIs | |||
Some examples of how to use it, can be found here: | |||
[https://github.com/corny/luftdaten-python/blob/master/main.py#L82 here] and | [https://github.com/corny/luftdaten-python/blob/master/main.py#L82 here] and | ||
[https://github.com/verschwoerhaus/ttn-ulm-muecke/blob/master/tasks/luftdaten.py#L34 this code from ttn-ulm-muecke]. | [https://github.com/verschwoerhaus/ttn-ulm-muecke/blob/master/tasks/luftdaten.py#L34 this code from ttn-ulm-muecke]. | ||
* data is sent as a HTTP POST to https://api.luftdaten.info/v1/push-sensor-data/ | * data is sent as a HTTP POST to https://api.luftdaten.info/v1/push-sensor-data/ (NOTE: the trailing slash!) | ||
* the HTTP POST uses headers "X- | * the HTTP POST uses headers "X-Pin" and "X-Sensor" (not case-sensitive it appears) | ||
** header "X- | ** header "X-Pin" indicates the type of data | ||
*** 1 = SDS011 | *** 1 = SDS011 or PMS7003 | ||
*** 3 = BMP180 | *** 3 = BMP180 | ||
*** 5 = PPD42NS | *** 5 = PPD42NS | ||
*** 7 = DHT22 | *** 7 = DHT22 | ||
*** 11 = BME280 | *** 11 = BME280 | ||
** header "X-Sensor" | ** header "X-Sensor" indicates the unique sensor id, for example "esp8266-9137604" | ||
** | ** header "Content-Type" with value "application/json" (NOTE: API describes this header, but it's not explicitly sent by the implementations above) | ||
* the body of the POST is JSON with the following fields: | * the body of the POST is JSON with the following fields: | ||
** "software_version": string containing the software version of the sender, for example "python-dusty 0.0.1" | ** "software_version": string containing the software version of the sender, for example "python-dusty 0.0.1" | ||
** "sensordatavalues": array of structures containing measurement data, looking like this: | ** "sensordatavalues": array of structures containing measurement data, looking like this: | ||
*** "value_type" (when X-PIN=1): string describing the measurement item type, can be "P1" (PM10 value) or "P2" (PM2.5 value) with dust value in ug/m3 | *** "value_type" (when X-PIN=1): string describing the measurement item type, can be "P1" (PM10 value) or "P2" (PM2.5 value) with dust value in ug/m3. It appears there is also an unofficial "P0" field which encodes for the PM1.0 value. | ||
*** "value_type" (when X-PIN=7): string describing the measurement item type, can be "temperature", "humidity" | *** "value_type" (when X-PIN=7): string describing the measurement item type, can be "temperature", "humidity" | ||
*** "value_type" (when X-PIN=11): string describing the measurement item type, can be "temperature", "pressure", "humidity" | *** "value_type" (when X-PIN=11): string describing the measurement item type, can be "temperature", "pressure", "humidity" | ||
*** "value": | *** "value": field containing the measurement value (NOTE: in string quotes, not as numeric values!) | ||
Other meta-information like latitude/longitude of the sensor, type of sensor can be configured once on https://devices.sensor.community/ . | |||
This is linked to your measurements by means of the unique sensor id. | This is linked to your measurements by means of the unique sensor id. | ||
Latest revision as of 12:15, 1 January 2021
| Project Dust Sensor | |
|---|---|
| |
| Experiments with a dust sensor | |
| Status | Completed |
| Contact | bertrik |
| Last Update | 2021-01-01 |
Introduction
The info on this page is obsolete:
- The luftdaten.info platform is now called sensor.community
- I modfied my sensor into a sensor.community node, so there is no longer an intermediate MQTT step
To get an idea of the levels of atmospheric particulate matter around my house, I ordered some dust sensor modules to play around with. In particular, I ordered these ones:
- The Plantower PMS 7003 (AliExpress link);
- The SDS011 (AliExpress link).
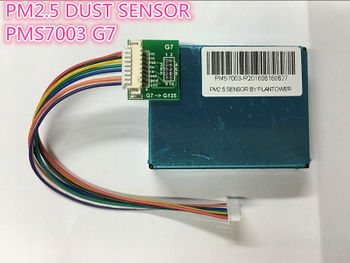
The PMS7003 is being advertised as an advanced generation of dust sensor (7th generation), while still reasonably priced (E15,-). It uses a laser to perform the measurement and contains a small fan to move the air around.
In parallel with the atmospheric particulate matter level measurement, my device also measures basic meteo data using a BME280 module: temperature, relative humidity and air pressure.
I recommend to also get the PMS7003 cable converter board. The pitch of the connector on the sensor module is slightly non-standard: 2 x 5 pins with a spacing of 0.05 inch (instead of the common 0.1 inch spacing).
The data produced by this sensor is sent as JSON to a MQTT server. From there it is picked up by a protocol converter: a custom written Java application to forward it to the RIVM samenmeten website and forward it to luftdaten.info
Future work
Next steps:
- build more luftdaten.info sensors and put them up in Gouda
- build a luftdaten.info sensor and put it up at RevSpace
- investigate a LoRa version of the software + TTN forwarder so we can put up a sensor at Meteo Gouda (kinderboerderij).
- can we use Cayenne as a container to carry the dust sensor data over LoRa?
Results
Below is a graph of the dust levels around new years eve 2017/2018, separated by particle size

You can clearly see a peak just after midnight.
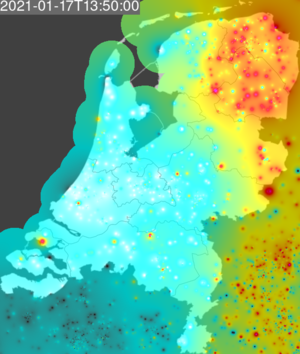
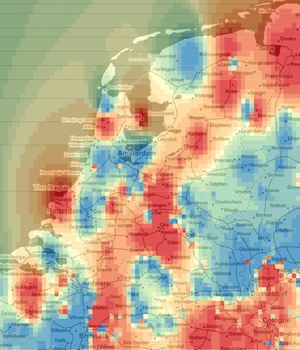
See also the map of these two experiments:
Hardware
PMS7003
PMS7003 data sheets can be found:
The PMS7003 takes 5V to run and communicates using 3.3V levels. I connect it using a NodeMCU.
The module gives an estimate of the total mass of the particles (microgram/m3) in 3 categories: PM10, PM2.5 and PM1.0, both for "standard particle" (CF-1) and "standard atmosphere". It also makes an estimate of the raw number of particles per size category, total 6 categories: 0.3-0.5-1.0-2.5-5.0-10 micrometer. I don't know how it actually works on the inside and is able to make a distinction between particles of different size.
| NodeMCU | PMS7003/BME280 | Remark |
|---|---|---|
| PMS7003-RST | Pulled-up to 3.3V on NodeMCU side, may not be actually needed | |
| PMS7003-SET | Pulled-up to 3.3V on NodeMCU side, may not be actually needed | |
| D1 | PMS7003-TX | NodeMCU receive, PMS7003 transmit |
| D2 | PMS7003-RX | NodeMCU transmit, PMS7003 receive |
| D3 | BME280-SDA | I2C-SDA |
| D4 | BME280-SCL | I2C-SCL |
| GND | PMS7003-GND / BME280-GND | GND ground reference |
| VU | PMS7003-VCC | USB voltage (5V) |
| 3.3V | BME280-VCC |
Special thanks to Crashjuh for helping with the cable, putting dupont connectors on them, making it a lot easier to connect the module to an ESP8266.
SDS011
Datasheets:
The SDS011 has a connector that fits a cable of type JST XH 2.54 mm 7-pin
Reverse engineering:
- it contains a STM32F038K6 processor in a UFQFPN32 package.
- interesting research paper that shows some of the internals of the SDS011: https://www.researchgate.net/publication/320290219_Assessment_of_Measurement_Uncertainties_for_a_SDS011_low-cost_PM_sensor_from_the_Electronic_Signal_Processing_Perspective
- another research paper (DE version?): https://www.researchgate.net/publication/332211397_Potenzial_und_Grenzen_des_kostengunstigen_SDS011_Partikelsensors_bei_der_Uberwachung_urbaner_Luftqualitat
- The optical sensor input pin (marked magenta in the research paper above) is PA2 (pin 8)
- SWD is on pins PA13/PA14 (pin 23/34), not easily accessible from the outside
Honeywell HPMA115S
Info:
- datasheet
- data/power-plug is Molex 51021-0800
Reverse engineering:
Software
The software archive can be found at github, it consists of the following parts:
- esp arduino software for reading the SDS011 and sending it as an MQTT stream;
- arduino software for reading the PMS7003 and sending it as an MQTT stream;
- a Java based bridge application that takes the MQTT data produced by the arduino and forwards it to other backends, like the RIVM influx database, luftdaten.info API.
Particulate matter sensor
The dust sensor software is written for the Arduino environment.
Typing 'make' builds and runs unit tests that verify parsing of measurement data and construction of command data. The sub-directory 'pms7003_esp' contains the .ino file to be opened in the Arduino IDE.
Libraries used:
- SoftwareSerial (built-in) for serial communication with the sensor
- WiFiClient (built-in) for WiFi connectivity
- WiFiManager (tzapu) to present a captive portal and allow selection of an AP to connect to the internet
- PubSubClient (Nick O'Leary) to handle publishing of data over MQTT
- BME280I2C (Tyler Glenn) and wire for interacting with a BME280 for basic meteo data (temperature, humidity, pressure)
The Arduino software has platformio.org configuration files, so if you're using that, you can just build it with
pio run
PMS7003
Reading measurements from the pms7003 works, sending commands to the module does not. I don't know yet whether this is a hardware or software problem.
Typing 'make' builds and runs unit tests that verify parsing of measurement data and construction of command data. The sub-directory 'pms7003_esp' contains the .ino file to be opened in the Arduino IDE.
SDS011
Typing 'make' builds and runs unit tests that verify parsing of measurement data and construction of command data. The sub-directory 'sds011_esp' contains the .ino file to be opened in the Arduino IDE.
References
Measurement data of this particular sensor:
- Grafana page of my sensor data.
- particulate matter graphs at madavi
- humidity and pressure graphs at madavi
Overview of dust sensor types and comparisons between them:
- Page on aqicn about the PMS5003/7003
- list of sensors from "samen meten aan luchtkwaliteit".
- another overview of dust sensors.
Citizen science projects for measuring airborne dust:
- Dutch RIVM official air quality map
- Dutch RIVM citizen science air quality map
- Dutch RIVM fireworks smog monitoring during new year's eve
- Belgian project "ik adem" - fijnstofmetingen
- German project luftdaten - measure air data by yourself
Dust measurement blog:
Visualizing dust data
See also my Stofradar page.
Grafana
To create nice graphs in Grafana, I used the following stack of tools/applications:
- a dust sensor, as described here, that publishes measurement data towards an MQTT server
- an MQTT server to accept the data and forward it to subscribers
- the 'Telegraf' importer that listens on the MQTT stream and converts the data to influx database
- an influx database, to store the measurement data
- grafana, to grab the data from the database and display it
Sensor
The sensor produces JSON, grouping the information from one message from the module together. Example
bertrik/pms7003/json {"alive":1138,"pms7003":{"pm1_0":2,"pm2_5":3,"pm10":4},"bme280":{"t":21.1,"rh":50,"p":1012.4}}
Telegraf
Things I did:
- downloaded and installed the Telegraf .deb from here.
- generated a default configuration using:
telegraf --input-filter mqtt_consumer --output-filter influxdb config >telegraf.conf
- edited the configuration to set mqtt and influxdb settings
- influxdb output plugin
- urls = ["http://172.29.0.1:8086"]
- mqtt_consumer plugin
- topics=[ "bertrik/pms7003/json" ]
- data_format="json"
- data_type="integer"
- influxdb output plugin
- test-run using 'telegraf <TODO>'
- copied the final telegraf.conf to /etc/telegraf and restarted the telegraf service
systemctl restart telegraf
Grafana
Add a data source, pointing to the influx DB. Provide credentials and verify by pressing the 'test connection' button.
Add a dashboard, add a row to the dashboard, add a graph panel to the row. Under 'metrics', add a query with the following properties:
- FROM mqtt_consumer WHERE topic = bertrik/pms7003/json
- SELECT field(amb_pm10)
- GROUP BY
- ALIAS BY PM10
- repeat for other particle sizes (amb_pm2_5 and amb_pm_1_0)
Regelgeving
 Regelgeving voor fijn stof (PM10)
 De regelgeving voor fijn stof (PM10) kent twee doelstellingen:
 - Een grenswaarde voor het jaargemiddelde: 40 µg/m3 als jaargemiddelde mag niet worden
   overschreden. Aan deze grenswaarde moet sinds 2005 worden voldaan. Behoudens
   ‘derogatie’ zijn geen uitzonderingen mogelijk (->Derogatie). Deze grenswaarde beoogt
   vooral bescherming te bieden tegen de langetermijneffecten van fijn stof.
 - Een grenswaarde voor het daggemiddelde: 50 µg/m3 als daggemiddelde mag op niet meer
   dan 35 dagen per jaar worden overschreden. 5 Aan deze grenswaarde moet sinds 2005
   worden voldaan. Behoudens ‘derogatie’ zijn geen uitzonderingen mogelijk (->Derogatie).
   Deze grenswaarde is vooral bedoeld om bescherming te bieden tegen de
   kortetermijneffecten van fijn stof.
Sensor.community interface
Most of the sensor.community upload protocols are described on the sensor.community wiki.
Some examples of how to use it, can be found here: here and this code from ttn-ulm-muecke.
- data is sent as a HTTP POST to https://api.luftdaten.info/v1/push-sensor-data/ (NOTE: the trailing slash!)
- the HTTP POST uses headers "X-Pin" and "X-Sensor" (not case-sensitive it appears)
- header "X-Pin" indicates the type of data
- 1 = SDS011 or PMS7003
- 3 = BMP180
- 5 = PPD42NS
- 7 = DHT22
- 11 = BME280
- header "X-Sensor" indicates the unique sensor id, for example "esp8266-9137604"
- header "Content-Type" with value "application/json" (NOTE: API describes this header, but it's not explicitly sent by the implementations above)
- header "X-Pin" indicates the type of data
- the body of the POST is JSON with the following fields:
- "software_version": string containing the software version of the sender, for example "python-dusty 0.0.1"
- "sensordatavalues": array of structures containing measurement data, looking like this:
- "value_type" (when X-PIN=1): string describing the measurement item type, can be "P1" (PM10 value) or "P2" (PM2.5 value) with dust value in ug/m3. It appears there is also an unofficial "P0" field which encodes for the PM1.0 value.
- "value_type" (when X-PIN=7): string describing the measurement item type, can be "temperature", "humidity"
- "value_type" (when X-PIN=11): string describing the measurement item type, can be "temperature", "pressure", "humidity"
- "value": field containing the measurement value (NOTE: in string quotes, not as numeric values!)
Other meta-information like latitude/longitude of the sensor, type of sensor can be configured once on https://devices.sensor.community/ . This is linked to your measurements by means of the unique sensor id.