PowerLight
| Project PowerLight | |
|---|---|

| |
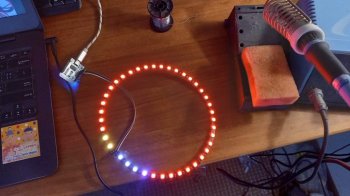
| Show energy mix of dutch power generation as a pie chart on a LED ring | |
| Status | In progress |
| Contact | bertrik |
| Last Update | 2022-07-12 |
The concept
Draw the current power generation-mix as a kind of pie chart on a LED ring light, with colors representing a fraction of a specific power generation source.
For example:
- blue: wind power
yellow: solar powersee belowgreen: power from biomasssee below- purple: power from nuclear
- red: fossil
- grey: other
Power generation data
There is no open data available with reasonably complete power generation fractions!
The solar power problem
In particular the solar power fraction is incomplete, but also the biomass figures are missing. See:
- https://berthub.eu/articles/posts/dutch-electrical-power-figures-2/ (text)
- https://energy-charts.info/charts/energy_pie/chart.htm?l=en&c=NL note how the solar part is tiny
There is a model to estimate this fraction at https://api.netanders.io/, however you cannot use this API without a key (and you can't just get a key).
Some ideas to fix this gap somewhat:
- Correlate official reported solar data with the model, and extract a kind of tennet-reported->best-guess-actual multiplication factor
- Use yesterday's solar prediction data from ENTSO-E. The number seen here seems to correlate reasonably well with the number shown at https://energieopwek.nl/ (which bases itself on the netanders model)
Information about ENTSO-E generation domain API: https://transparency.entsoe.eu/content/static_content/Static%20content/web%20api/Guide.html#_generation_domain
Hardware
Parts:
- LED ring light https://nl.aliexpress.com/item/1005003798658173.html
- Wemos D1 mini with an ESP8266
Software
The software consists of two parts:
- backend part that collects the power generation data
- light part that visualizes the power generation as fractions on a LED ring
Backend
Source code: https://github.com/bertrik/energymix-server
In progress, run as a REST-like resource at http://stofradar.nl:9001/energy/latest (1-minute rate limit)
Returns a JSON-structure like:
{
  "time": 1657057500,
  "total": 9122,
  "mix": [
    { "id": "solar", "power": 0, "color": "#FFFF00"},
    { "id": "wind", "power": 4, "color": "#0000FF"},
    { "id": "fossil", "power": 86, "color": "#FF0000"},
    { "id": "nuclear", "power": 5, "color": "#FF00FF"},
    { "id": "other", "power": 4, "color": "#444444"},
    { "id": "waste", "power": 1, "color": "#444444"}
  ]
}
- time is a unix time stamp in seconds, representing the end of the 15-minute period that the power figures refer to
- total is the total current electrical power (megawatt), suitable for display (on a numeric display inside the ring for example)
- energymix is an array of power sources, each with:
- a short unique id
- most recent known power (megawatt)
- hex color, for display on the led ring
Light
Source code: https://github.com/bertrik/PowerLight