MainsFrequency2.0
| Project MainsFrequency2.0 | |
|---|---|

| |
| A simple mains frequency counter | |
| Status | In progress |
| Contact | bertrik |
| Last Update | 2023-05-30 |
Introduction
This project is a reboot of this earlier main frequency counter, aiming for more accuracy and lower latency.
It's based on the Arduino platform, using an ESP8266 to do the wifi/network/MQTT stuff. The frequency measurement principle is to measure the time between zero crossings (in a statistically robust way).
Concept
Instead of just counting pulses from zero-crossings, we sample the actual 50 Hz waveform and try to estimate the zero-crossing as accurately as possible.
Desired end result:
- get more accurate frequency measurement, aiming for 1 milli-Hertz accuracy
- get more responsive frequency measurement, i.e. instantaneous value (1 second), not a running average over 50 seconds.
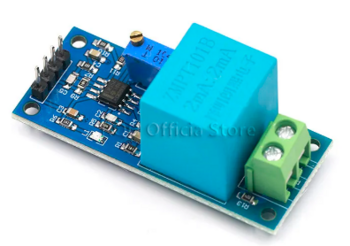
A suitable module for relatively safely sampling the mains voltage is this ZMPT101B module. It contains a transformer and an op-amp circuit.
More information about this module:
Algorithm for getting accurate instantaneous frequency out of it:
- Sample the mains frequency waveform during approximately one second (say 5 - 10 kHz)
- Determine the median, lower and upper quartiles of the waveform, and shift data so its values are symmetrically around zero
- Calculate zero crossings by doing linear regression to find the zero-crossing of the wave in the region around the zero crossing (in between the quartile values), this gives sub-sample time resolution
- The linear regression runs a kind of state machine, just keeping track of sum(x), sum(y), sum(x*x), sum(x*y) is enough to perform a linear regression at any time
- Do this over the approximately 50 cycles contained in the one second data and determine average frequency
-> this should give about 1 millihertz frequency resolution in one second
Ideas:
- While playing around with an STM32 blue pill, it turned out you might not need a mains power interface at all. A piece of wire picks up ambient 50 Hz already. Typical accuracy of the STM32 clock crystal appears a bit lower than that of the ESP8266, but for visualisation this might not be so important. We don't need the WiFi-functionality of the ESP8266 if just visualizing. This simplifies things: required hardware is just bluepill + piece-of-wire + RGB LED ring.
- A raspberry pi pico appears to be able to satisfy many requirements:
- Able to sample mains frequency directly from ambient signals on its sensitive A/D input, without the need for a transformer circuit
- Able to sample a signal with good timing accuracy, it has a crystal better than 30 ppm (0.0015 Hz at 50 Hz)
- Might allow control of a LED ring using FastLED for visualisation (not possible with STM32), to be researched
- Has WiFi support, although a bit iffy on the Arduino platform, for publishing directly to mqtt
- Relatively inexpensive
Visualisation
There are (at least) the following two ways we can output the data:
- publish frequency as a number over WiFi / MQTT for visualization as a graph-over-time on our grafana server
- idea: directly on a LED ring. The ring shows an integer number (e.g.) of 50 Hz cycles, with the color of the pixel indicating the analog value
Mains waveform ring
Concepts:
- The LED ring shows the raw waveform over time. Position along the ring is time, intensity/color is based on the instantaneous value of the mains voltage. So (for example) three 50 Hz cycles show up as 3 dark spots and 3 light spots around the ring, approximately 120 degrees apart. Basically it shows the phase compared to a reference 50 Hz frequency.
- The LED ring is drawn based on a reference time (derived from the crystal oscillator), assumed to be exactly 50 Hz. A slightly fast mains waveform results in a clockwise rotation of the waveform pattern, a slightly slow mains waveform results in a counter-clockwise rotation of the waveform pattern.
- Use a colourful gradient, not just intensity. Example: https://github.com/FastLED/FastLED/wiki/Gradient-color-palettes
Calculation:
- Mains frequency is nominally 50 Hz, so period is 20 ms (0.02 sec)
- With three waveforms around the ring, the ring represents 60 ms of mains signal
- Intended LED ring has 24 RGB LEDs, so 60ms / 24 LEDs = 2.5 ms per LED. So we could sample the waveform at 400 Hz, and put 1 sample on each LED.
- Example: 16 LED ring -> sample frequency 266.66.. Hz, or sample at 800 Hz and average 3 samples/LED
- Example: 40 LED ring -> sample frequency 666.66.. Hz, or sample at 2000 Hz and average 3 samples/LED
- Example: 45 LED ring -> sample frequency 750 Hz
- Example: 60 LED ring -> sample frequency 1000 Hz
Hardware
For measurement with an ESP8266, like a Wemos D1 mini or nodemcu, you need to put a 180k ohm resistor in line with the output from the ZMPT101B to the A0 input. The A0 input already has a 220k/100k resistive divider, effectively becoming a 400k/100k resistive divider with the series resistor, scaling down the 0-5V range to the 0-1V range required for the ADC on the ESP8266.
The "blue pill" seems to have too low accuracy of the built-in crystal, about 100 ppm, while we need about 20 ppm to get 1 mHz resolution. Notes about blue pill crystal accuracy: https://sparklogic.ru/arduino-for-stm32/accurate-blue-pill-clock-frequency-adjustment.html
| ZMPT101B | Wemos D1 mini | Remark |
|---|---|---|
| GND | GND | Ground |
| VCC | 5V | Powers the ZMPT101B from the wemos D1 mini |
| OUT | A0 | Analog mains waveform, 0..5V, 180 kohm resistor in series |
Software
Github project: https://github.com/bertrik/MainsFrequency
To flash the esp8266:
- install platformio
- enter the esp8266sampler directory
cd esp8266sampler
- compile and upload
pio run -t upload