PowerLight: Difference between revisions
| Line 48: | Line 48: | ||
"total": 1600, | "total": 1600, | ||
"energymix": [ | "energymix": [ | ||
{ "id": "solar | { "id": "solar", "percent": 40, "color": "#FFFF00"}, | ||
{ "id": "wind | { "id": "wind", "percent": 25, "color": "#0000FF"}, | ||
{ "id": "fossil | { "id": "fossil", "percent": 25, "color": "#FF0000"}, | ||
{ "id": "biomass | { "id": "biomass", "percent": 5, "color": "#00FF00"}, | ||
{ "id": "nuclear | { "id": "nuclear", "percent": 5, "color": "#FF00FF"} | ||
] | ] | ||
} | } | ||
Revision as of 13:56, 1 July 2022
| Project PowerLight | |
|---|---|

| |
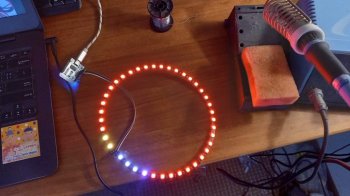
| Show energy mix of dutch power generation as a pie chart on a LED ring | |
| Status | In progress |
| Contact | bertrik |
| Last Update | 2022-07-01 |
The concept
Draw the current power generation-mix as a kind of pie chart on a LED ring light, with colors representing a fraction of a specific power generation source.
For example:
- blue: wind power
- yellow: solar power
- green: power from biomass
- purple: power from nuclear
- red: fossil + other
Power generation data
This is a bit of a problem. There is no open data available with reasonably complete power generation fractions!
The solar power problem
In particular the solar power fraction is incomplete, see also:
- https://berthub.eu/articles/posts/dutch-electrical-power-figures-2/ (text)
- https://energy-charts.info/charts/energy_pie/chart.htm?l=en&c=NL note how the solar part is tiny
There is a model to estimate this fraction at https://api.netanders.io/, however you cannot use this API without a key (and you can't just get a key).
Hardware
Parts:
- LED ring light https://nl.aliexpress.com/item/1005003798658173.html
- Wemos D1 mini with an ESP8266
Software
The software consists of two parts:
- backend part that collects the power generation data
- light part that visualizes the power generation as fractions on a LED ring
Backend
To be implemented, this will probably run on my web page stofradar.nl. Some REST-like resource like http://stofradar.nl:9001/power/latest
Returns a JSON-structure like:
{
  "time": 1656490664,
  "total": 1600,
  "energymix": [
    { "id": "solar", "percent": 40, "color": "#FFFF00"},
    { "id": "wind", "percent": 25, "color": "#0000FF"},
    { "id": "fossil", "percent": 25, "color": "#FF0000"},
    { "id": "biomass", "percent": 5, "color": "#00FF00"},
    { "id": "nuclear", "percent": 5, "color": "#FF00FF"}
  ]
}
- time is a unix time stamp in seconds, representing the end of the period that the power figures refer to
- total is the total current electrical power usage, suitable for display (inside the ring for example), unit yet to be determined
- energymix is an array of percentages along with their colors, to be displayed clockwise on the led ring, mandatory fields
- percent
- color